Version 10
Telemetry view with combined data traces. The position, height and visibility can be adjusted on per trace.
Multilap view ACC. You can load or during the racing the live laps get added to the data.
Multilap view AMS2.
Map view for live and offline data.
Car info is one option.
Driving pane on seeing details about your car.
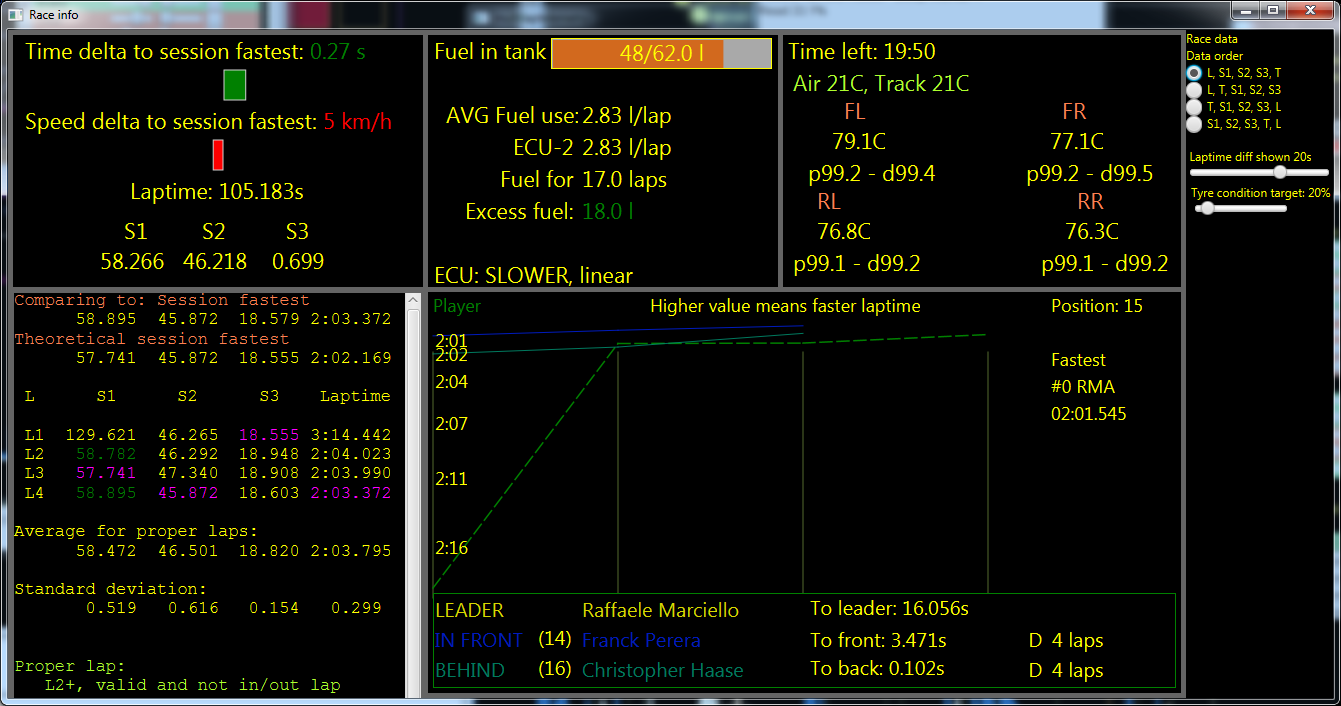
RaceInfo for managing tactical aspects of the race.
Detailed timing and other info about all cars in the race.
Race history view
Race history for AMS2.
Same data normalized to my lap times.
Lap comparison to visuall compare two laps.
DriverDNA, visuall find areas, where your driving is not consisten.
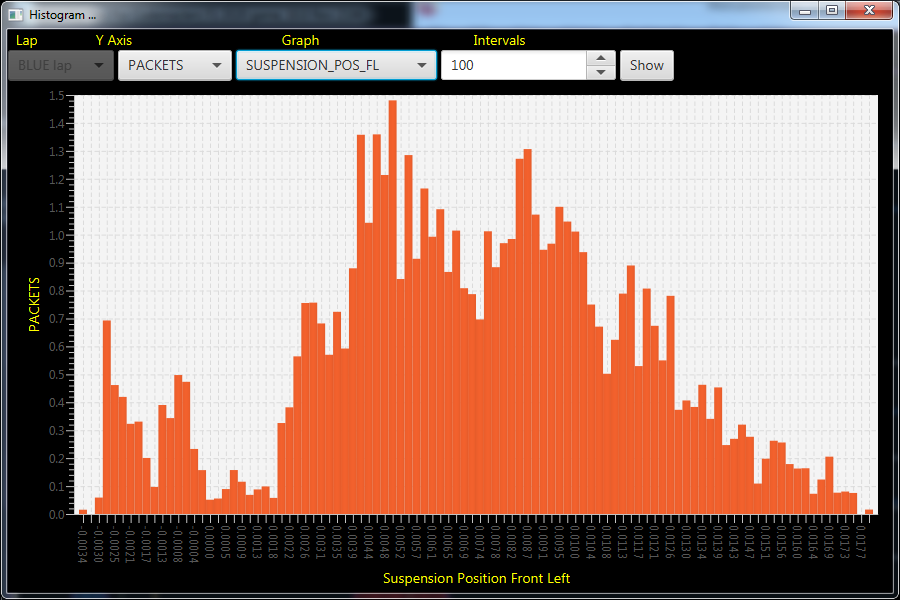
Historgram, almost all data can be viewed also in this format.
Older versions
Telemetry graphs V9
You can compare your current lap or an earlier saved lap with the fastest lap or another saved lap.
You can have many windows open at the same time.
Race Info V9
See many details of the race status.
Race History V9
See race laptime history.
See laptime history.
Track position history V9
See race track position history.
Lap visual comparison V9
Compare throttle use.
Compare braking.
Compare ERS.
Compare Fuel use.
V9_F1_track_positionTelemetry graphs V8
You can compare your current lap or an earlier saved lap with the fastest lap or another saved lap.
Many windows opens at the same time.
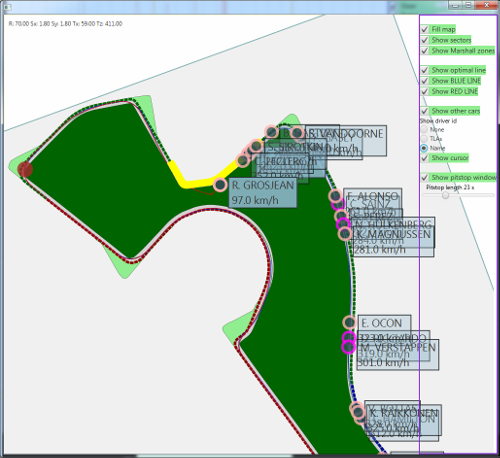
Map with driver names and the speeds
Laptime history compared agains leader/winner
Track position history
Telemetry
You can compare multiple laps.
Map panel with racing lines
You can see the lines, you have taken e.g. during the race and compare them to the fastest lap and the "ideal" racing line.
And with 6.0 onwards in race you can also see AI/other cars.
You can zoom into the map view to see in detail your driving lines.
Race history
See how track positions evolved during the race
See how laptimes evolved over the race.
Race info
In race info panel you can see lot of different information about the laptimes etc.
Driving info
In driving info panel you can different data about driving, like g-forces, gear usage + stats etc.
Lap comparison
Lap comparison panel, where you can visually compare different laps.
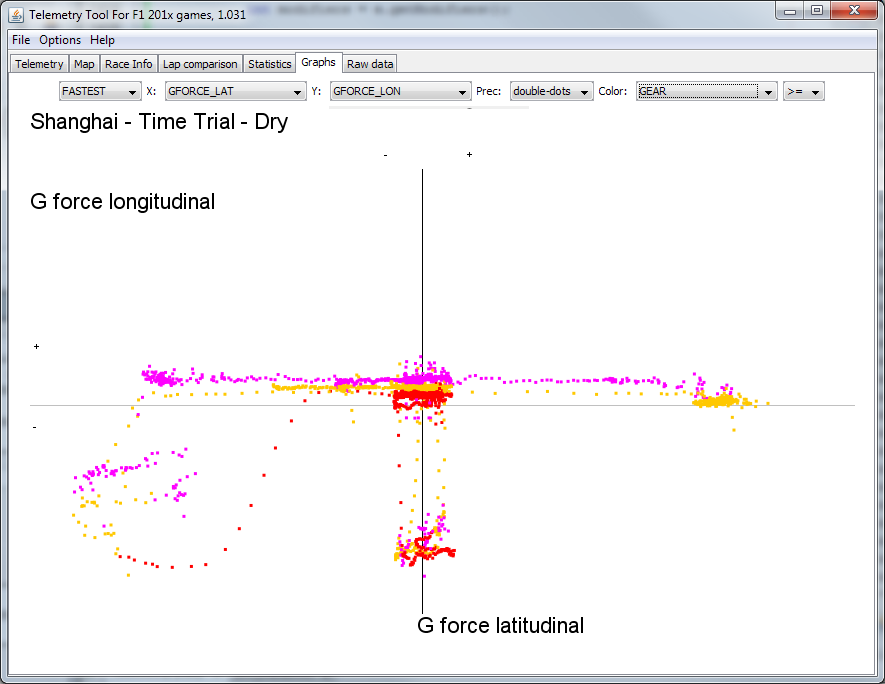
Graph panel
Graph panel allows you to analyse data in more detail.


